Let’s face it.
Lead generation is essential for any business. The problem is that competition between companies is getting more and more complicated. So how do you outwit your competitors and scale your lead generation efforts?
You track the right KPIs. (It can be tough if you aren’t sure what to track, but don’t stress – We will help you.)
If you do this, it will help you find out what’s working and in turn, you can scale your efforts.
This article will share why tracking lead generation metrics is important, how it can help boost sales, some of the best lead generation KPIs to track.
Why the Right Lead Generation Metrics Matter
How would you know what’s working, and what’s not, if you don’t monitor your KPIs? They help you understand the health of your campaigns, figure out any issues, and predict future performance. If you have this valuable information, you will be able to create lead generation strategies that bring in the big bucks.
Without these insights, you run the risk of wasting time on strategies that don’t work, damaging deliverability, or targeting the wrong audience.
By tracking the right metrics, you can:
-
Assess the performance of your campaigns.
-
Optimize workflows for consistency and scalability.
-
Figure out any warning signals before they impact your results.
-
Increase your ROI by focusing on data-driven strategies.
How to Figure Out The Right Lead Generation KPIs & Metrics

This will depend on which industry you’re in, and which lead generation channels you use. For example, at Salesbread, when it comes to cold email outreach we will look at:
-
The number of prospects at the start of your campaign
-
Your positive reply rate
-
Your deliverability health
…. And so on…
Whereas if you’re using LinkedIn, you might want to track:
-
Connection acceptance rate
-
Reply rate
-
Positive reply rate
-
Reply ratio
And then if you’re tracking SEO for example, you might look at:
-
Which articles are bringing in the most conversions
-
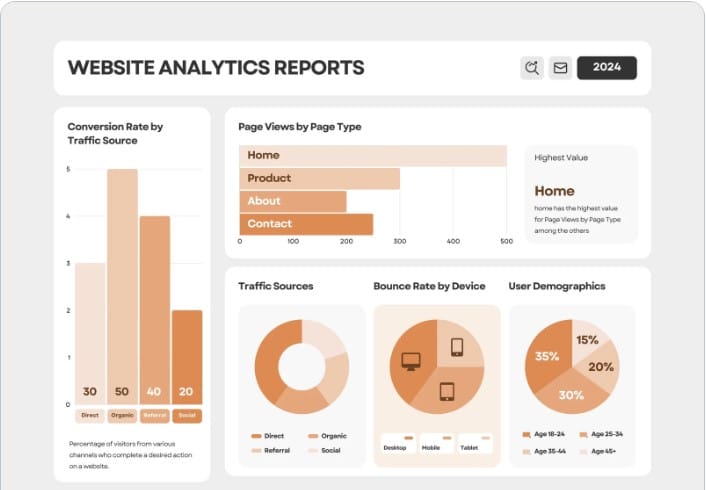
Your traffic
-
Which paid ads are performing the best
-
What are the top visits by device
-
Or which countries are visiting your site the most
-
Conversion rate
So it really depends on what your goals are. Once you figure out what you would like to achieve it’s easier to choose the best KPIs to track.
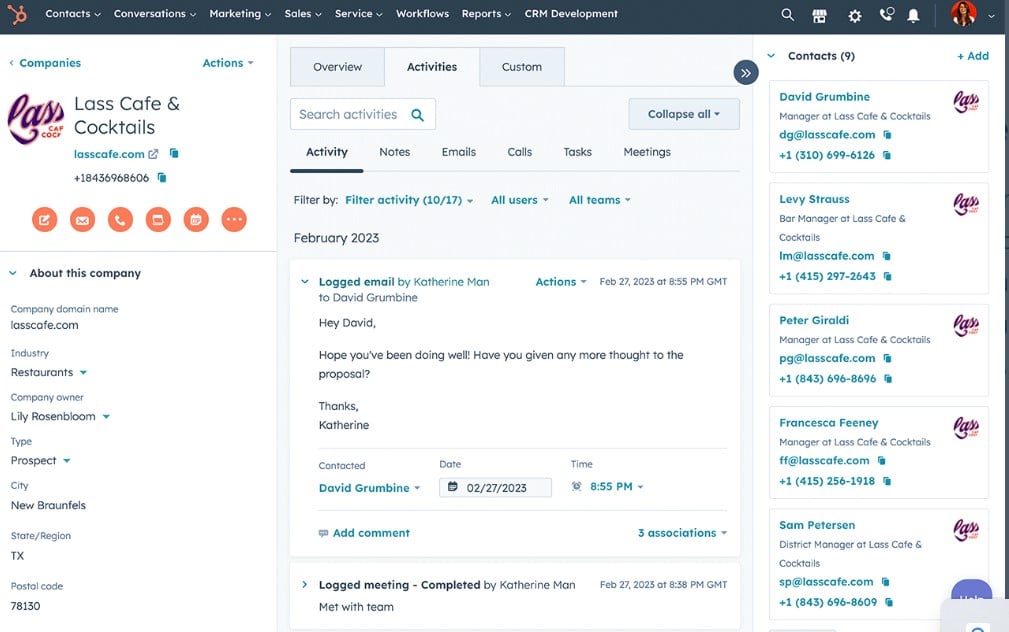
You might want to invest in various tools as well, such as Google Analytics, Google Search Console, Looker Studio, and even HubSpot’s free lead management system.

15 KPIs and metrics for Boosting Performance
1. Number of Prospects in your list
Before evaluating replies, conversion rates, or ROI, you need to ensure that your campaigns have enough volume to produce meaningful insights.
Sending emails to a mere handful of prospects won’t yield statistically significant results. Experts suggest starting with at least 100–150 prospects before analyzing performance.
Key considerations:
-
Volume consistency: Are you starting the same number of prospects every week to maintain a steady flow?
-
Lag time: Account for delays in replies and follow-ups when analyzing early-stage metrics.
2. Reply Rate
Your reply rate is a crucial indicator of your campaign’s ability to generate engagement. A double-digit reply rate (10% or higher) signals strong deliverability and effective messaging. Conversely, low reply rates might point to issues with your prospect list, deliverability, or message relevance.
Pro tip:
If reply rates are below expectations, explore potential deliverability issues first. Then, evaluate whether your messaging resonates with the target audience. If not try adding more personalization
3. Positive Reply Rate
It’s not just about replies—it’s about meaningful responses that indicate interest. Positive reply rates reveal how well your messaging converts prospects into potential leads.
Strategies to boost positive replies:
-
Focus on ultra-personalized messages that address specific pain points.
-
Regularly refine your segmentation to ensure you’re reaching the right audience.
4. Weekly Metrics
It’s really important for campaign managers to monitor the weekly progress of your cold email or LinkedIn outreach campaigns., including:
-
The number of prospects added to the pipeline.
-
Replies received, segmented by positive and neutral/negative.
-
Deliverability rates per inbox or domain.
Weekly tracking enables you to spot trends and respond proactively to sudden changes, such as a drop in deliverability or engagement.
5. Deliverability Health
Deliverability rates often serve as the first warning sign of campaign trouble. Low deliverability can stem from spammy messaging, outdated prospect lists, or insufficient inbox warm up. Regularly check deliverability at the inbox and domain levels to detect issues early.
Best practices:
-
Rotate domains and monitor their health to maintain high deliverability.
-
Warm up new inboxes to avoid being flagged as spam.
-
Monitor bounce rates as part of your deliverability analysis.
6. Lead Quality: From Positive Replies to SQLs
Positive replies are only the beginning. The ultimate goal is to convert these replies into sales-qualified leads (SQLs). SQLs indicate that a lead has been vetted and is ready for a meaningful sales conversation.
Key steps:
-
Track the percentage of positive replies that book calls.
-
Evaluate call outcomes to ensure leads align with your target customer profile.
-
Collaborate with sales and marketing teams to refine the lead handoff processes.
7. Pipeline Readiness
For campaign managers, keeping the pipeline full is critical.
Always ensure there are enough qualified prospects to sustain future campaigns. However, CEOs and higher-level executives should focus less on this operational detail and more on the broader metrics like SQLs and revenue impact.
Diagnosing Campaign Issues
Even if you track metrics to the tee, campaigns sometimes veer off course. Knowing how to diagnose problems quickly can save time and resources.
Step 1: Check Deliverability First
Deliverability issues often manifest as low reply rates or inconsistent engagement. Use tools to monitor inbox performance and domain reputation, and rotate assets as needed to avoid spam traps.
The last place you want to end up is in the spam folder. People don’t read spam. So even if you have written the perfect message, and it ends up in spam, you’re going to see low reply rates.
Step 2: Evaluate Messaging and List Quality
If deliverability checks out, but replies remain low, the issue may lie in your message or prospect list. Ensure your messaging is clear, compelling, and personalized. Additionally, refine your prospect segmentation to align with your ideal customer profile (ICP).
This article shares some tips on writing personalized messages.
Step 3: Analyze Week-on-Week Metrics
Compare weekly data for signs of inconsistency or decline. Sudden drops in replies or engagement might indicate seasonal factors, such as holidays, or internal issues like message fatigue.
Step 4: Monitor Conversion Rates
A steady stream of replies without conversions suggests a disconnect between initial engagement and downstream sales processes. W
Work with your sales team to identify bottlenecks, whether in qualification, follow-up timing, or call handling.
Aligning Metrics with Business Goals
Metrics mean little without context. Tailor your focus based on your role and overarching business objectives.
For CEOs: High-Level KPIs
-
SQL generation: Are campaigns producing quality leads?
-
Pipeline growth: How are campaigns contributing to long-term revenue?
-
ROI: Is lead generation driving measurable business impact?
For Campaign Managers: Tactical Insights
-
Weekly prospecting volume: Is the pipeline consistently filled?
-
Deliverability health: Are inboxes and domains performing optimally?
-
Positive reply rates: Is messaging resonating with the audience?
For Sales Teams: Lead Outcomes
-
Call bookings: Are positive replies converting into scheduled meetings?
-
Lead quality: Do booked calls align with ICPs?
-
Conversion rates: Are SQLs closing at expected rates?
Expert Tips for Scaling Campaign Success
1. Simplify Dashboards

Too much data can obscure what really matters. Focus on the handful of metrics that directly impact performance, such as reply rates, positive responses, and SQLs.
2. Leverage Automation
Use tools like QuickMail to streamline processes like inbox monitoring, campaign sequencing, and follow-ups. This reduces manual work while improving scalability.
3. Embrace Personalization
Generic messages won’t cut it in today’s B2B landscape. Invest in hyper-personalized campaigns that demonstrate a genuine understanding of your prospect’s pain points.
4. Iterate Based on Feedback
Campaign performance is rarely static. Regularly review your metrics to identify opportunities for improvement, whether that’s refining copy, experimenting with new audiences, or testing different outreach channels.
5. Collaborate Across Teams
Effective lead generation requires alignment between marketing and sales. Establish clear handoff processes and maintain open communication to ensure leads are properly nurtured through the funnel.
Other key metrics to track during the lead generation process
8. Cost per lead
Cost per lead (CPL) is one of the essential metrics that you don’t want to miss out on. It will help you measure the effectiveness of marketing strategies in lead generation success. CPL will show how much is spent to generate a single lead.
Tracking this involves dividing the total cost of a campaign by the number of leads generated ( CPL = Total Campaign Cost / Number of Leads.)
You can use tools like Google Ads or HubSpot to monitor this metric. CPL helps B2B marketing teams optimize their budget and assess whether advertising investments align with business growth goals.
9. Customer lifetime value
Customer Lifetime Value (CLV) measures the total revenue a business can expect from a customer during their relationship.
This will help you evaluate the value customers bring to your company.
CLV is calculated by multiplying the average purchase value by purchase frequency and customer lifespan. (CLV = (Average Purchase Value × Purchase Frequency) × Customer Lifespan)
Here’s an example:
Imagine that you owned a SaaS company and this is what you could expect from 1 customer over a 36-month period:
-
Average Purchase Value = $100/month.
-
Purchase Frequency = 1 (monthly subscription).
-
Customer Lifespan = 36 months.
CLV = $100 × 1 × 36 = $3,600.
This indicates that each customer contributes $3,600 in revenue over their relationship. Monitoring your CLV will allow you to optimize acquisition costs, refine your marketing campaigns, and target high-value customers effectively.
High CLV often shortens the sales cycle by targeting valuable prospects.
10. Website Traffic

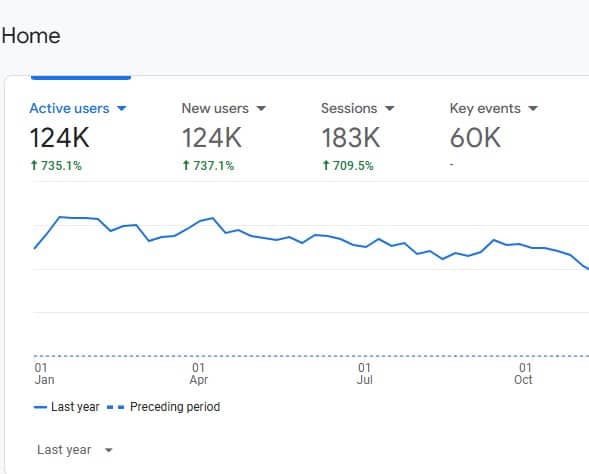
Website traffic will show you the number of website visitors that engage with your content, serving as a barometer for b2b lead generation KPIs.
Be careful though.
Even if you have a ton of traffic, always check your conversions. Huge amounts of traffic mean nothing if your site isn’t converting visitors into buyers.
Tools like Google Analytics track traffic sources, showing how effective marketing strategies are in attracting visitors. Monitoring traffic trends can also improve advertising ROI by pinpointing high-performing channels.
To calculate your website’s conversion rate, use the formula:
Conversion Rate = (Number of Conversions ÷ Number of Website Visitors) × 100
Example:
If your website had 5,000 visitors in a month and 250 of them completed a desired action (e.g., filling out a lead form), the conversion rate would be:
(250 ÷ 5,000) × 100 = 5%.
11. Bounce Rate

Bounce rate shows the percentage of website visitors who leave after viewing only one page, highlighting gaps in engagement. You can use Google Analytics or Looker Studio to track bounce rates and identify pages with high exit rates.
High bounce rates may indicate irrelevant content or slow loading times. You might want to see if you can either improve the content of these pages, or loading times.
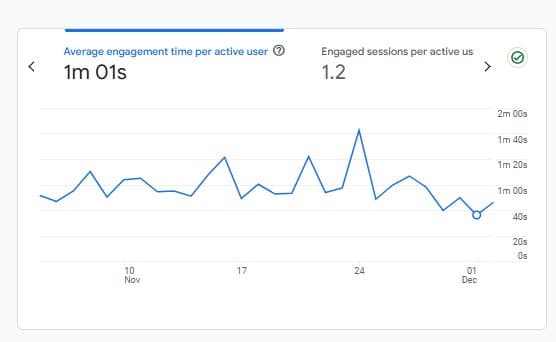
12. Engagement time

Look at how long readers are spending on your articles. If you notice that they exit an article relatively quickly it might mean that your content isn’t providing them with enough value or answering their question.
This will allow you to reassess your content and see how it compares to what’s ranking in the top articles.
- Does your article provide the reader with an answer to their question?
- Is your article helpful?
- How does it compare to the articles that have a longer engagement time?
By tracking these valuable insights you will be able to adapt your content to what readers enjoy reading.
13. Marketing Qualified Leads (MQLs)
Marketing Qualified Leads (MQLs) are prospects who have shown enough interest in your offerings to move deeper into the lead qualification process. You can track MQLs with CRM tools like Salesforce.
By focusing on MQLs, B2B marketing teams can prioritize leads with high conversion potential, thus reducing wasted efforts, time, and money. This will improve your overall sales cycle efficiency.
14. Return on investment (ROI)
Tracking ROI is like keeping score in a game—you need to know if your efforts are paying off. It tells you whether the money and time you’re pouring into lead generation is actually working.
By understanding ROI, you can spot the campaigns bringing in the most value, cut back on what’s not working, and make smarter choices moving forward. Plus, it keeps everyone focused on what really matters: turning investments into real business growth and success.
To calculate Return on Investment (ROI) in lead generation, use this formula:
ROI = [(Revenue from Leads – Cost of Lead Generation) ÷ Cost of Lead Generation] × 100
Example:
-
Revenue from Leads: $10,000
-
Cost of Lead Generation: $3,000
ROI = [($10,000 – $3,000) ÷ $3,000] × 100 = 233.33%.
This means the campaign generated a 233.33% return.
15. Lead Attribution
Lead attribution is about understanding which marketing efforts drive conversions. It assigns credit to touchpoints in the buyer journey, like an email campaign or a social ad, showing how they contribute to lead generation success.
Some tracking examples for lead attribution are:
-
Booking a sales call or demo
-
Filling out a website form or subscribing to your newsletter
-
Registering for a free event or webinar
-
Downloading white papers or an e-book
Tracking lead attribution will help you see what’s working and what’s not; This in turn will help you refine your strategies, and focus sales efforts in the right places. This in turn will maximize ROI.
In B2B marketing, clear attribution fuels smarter decisions and faster business growth.
Conclusion
Tracking the right lead generation metrics isn’t just about crunching numbers—it’s about making decisions that drive meaningful results that lead to more sales.
By focusing on key metrics like reply rates, SQLs, and deliverability health, you can create campaigns that not only perform well but also deliver consistent value to your business.
Whether you’re a CEO looking for high-level insights or a campaign manager fine-tuning operational details, hopefully, this article will help make tracking the right metrics easier.
If you’re interested in a free 15 minute strategy session, why not hop on a call with the founder of Salesbread? We would love to help you meet your sales goals.
